Friday 28 April 2017

Antarctica


This week’s guess the planet image comes from Earth and 
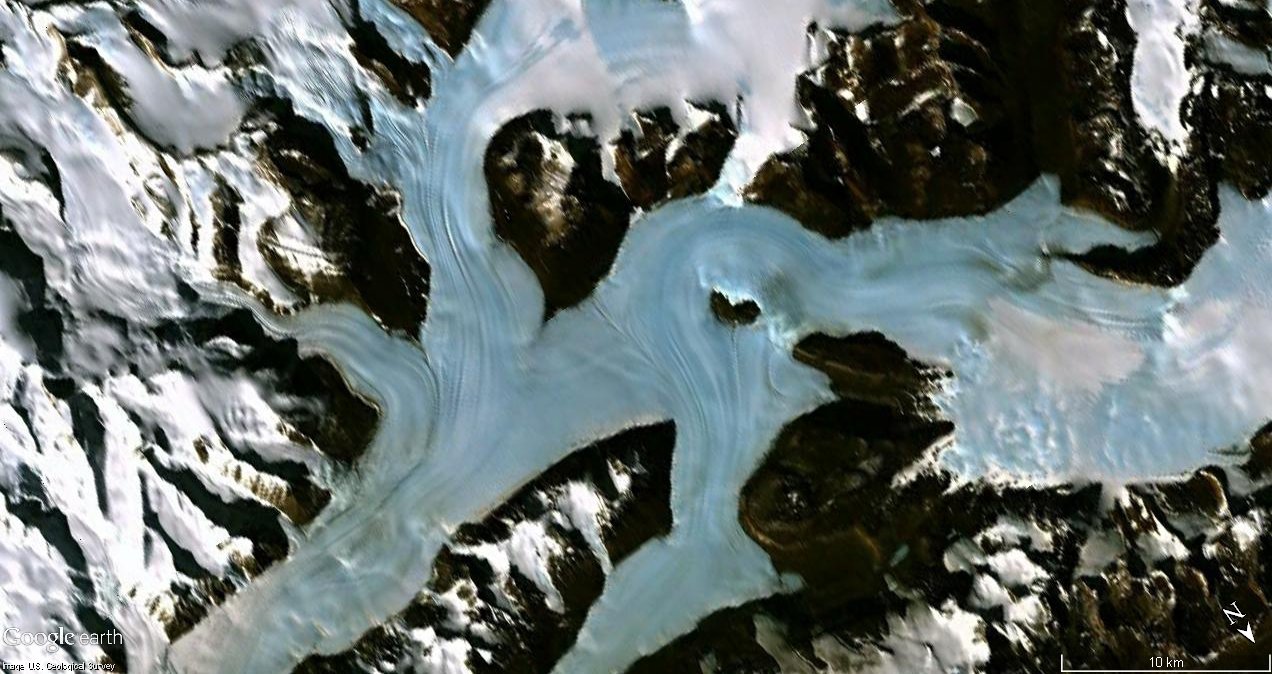
shows a region of Antarctica near the ross ice sheet. This image comes from Google Earth, and if we look at a larger view of the same area we can see that the glaciers flow down onto an ice shelf, which is breaking up into icebergs as it meets the sea. The area is striking as we can see several large valleys separated by rocky mountains. These valleys are covered by glaciers, and you can see lines in the ice which indicate how it is flowing down between the mountains. Several glaciers merge at the confluence of these valleys and you can see the ridges where the streams of ice meet. 


There is another region, not far from this part of Antarctica, which doesn’t look as striking in aerial photographs, but which I want to talk about as it is very significant for planetary science. This area is characterised by a very different property to the wet and icy regions seen above. This is the Antarctic dry valleys, the location of which are shown in the map below. These valleys are of great interest to both Earth scientists and those who study other planets. This is because; despite lying in ice locked Antarctica they are one of the driest places on Earth. The cold conditions in this part of Antarctica mean that there is very little precipitation, creating a cold desert which is an excellent reference point for studying the cold, dry environments of planets like Mars. 
 

Unlike most of Antarctica the dry valleys are mostly free of ice, and form a gravelly desert interspersed with polygonal patterned ground. This landscape looks a lot like some of the polar regions of Mars and is thus a prime candidate for analogue science. I’ve talked a lot about how similar features recur from one planet to another. By understanding how something evolves under terrestrial conditions we can extrapolate its behaviour on another world. In order to do this effectively we first need to find good counterparts for comparison. A lot of planetary science consists of comparing the landscapes of other planets to known terrestrial features to see which familiar landforms are the best fits. Sometimes we can do this in reverse. 

In addition to studying the landscape of the dry valleys we can look at their ecosystems as well. This is one of the most hostile places on Earth, and so very little life survives here. The hardy species which have evolved to occupy the dry valleys have very similar adaptations to those which would be needed to survive on the cold, dry and salty surface of Mars. Astrobiologists can study samples of these organisms, which are called “extremophiles” because they like very extreme environments. Organisms are collected from very cold or dry environments, and cultured in the lab. They can then be exposed to exaggerated conditions, which more accurately simulate the environment of other planets. This allows us to see whether they can evolve further to occupy a far more frigid niche, or whether there are limits beyond which they become dormant or die off. 

Almost every environment on Earth is inhabited by some sort of organism, however they have an advantage over those which might be found on other worlds. Terrestrial extremophiles can evolve from life forms that originated in less hostile environments, but which became progressively hardier as they moved into more dangerous climates. Many of these organisms could now survive under martian conditions, at least to an extent, however it is less certain that they could have evolved there from scratch. We thus need to consider whether Mars harbours small areas which are warmer or wetter. These would be more suitable for life to emerge and evolve, before expanding to colonise the more hostile areas. This sends us back to our spacecraft data to look at the landscape once more, and speculate as to which features of the environment might by indicative of warmer climates. 
 
For example we do see glacier like forms on Mars. This image from HiRISE looks strikingly similar to the image of terrestrial glaciers above. We see the same flow of material through a constricted valley and very similar lines and bands. This doesn’t necessarily mean that it is a wetter environment, there may not be any ice left in this martian glacier, as it could all have sublimated long ago, leaving only the dust and debris which it deposited. Nonetheless features like this are a clear indicator of the presence of large quantities of ice at some point during their geological history, and hint at a dynamic environment in the past if not the present.  Check out the page for this HiRISE image which has some more information about debris covered glaciers on Mars.


Image credits:
Antarctic glaciers via Google Earth
Map of the Antarctic dry valleys, USGS public domain image, via Wikipedia
HiRISE image of martian glacier like form via Wikipedia.

Monday 24 April 2017

Guess the Planet 27: Rocky

Here is this week's guess the planet image. What is going on in this rocky area, and which planet can it be found on? 


Check back on Friday for the answer.

Friday 21 April 2017

Interpreting Barchan Dunes


This week’s image comes from Mars and is a CTX image of a section of the large dune fields near the northern pole. These circumpolar dunes form a sea of shifting sand, which encircle the northern icecap. Different sections of the dune fields exhibit different types of dune patterns and, as I’ve discussed before the shapes of dunes can tell us a lot about the local wind conditions. 


This area is characterised by "barchan dunes". These crescent like shapes are often found in terrestrial deserts as well. Barchan dunes form when there isn’t enough sand to make a continuous blanket. It shifts from one place to another, forming piles and mounds. the sparse barchans on the left hand side of the image gradually coalesce into more continuous ripples to the right. This suggests that there is less loose sandy material on the one side of the image and more on the other.

Barchan dunes generally occur in places where the wind blows from a consistent direction, and so collects the sand into crescent shaped mounds. The shape of the dune is the result of the flow of air over it, giving them an aerodynamic shape. The points of the crescent point downwind, so the structure of these dunes tells us what the prevailing wind direction is. 

The upwind face of the dune is generally shallower than the downwind “slipface” which can be seen between the two horns of the dune. By measureing these angles we can learn about the movement of granular material. We know that the slip face will almost always be at the “angle of repose”. This is the steepest angle at which a slope made of dry material remains stable. It cannot become any steeper without collapsing, when the forces exerted on the slope exceed the frictional forces keeping the grains of sand together. 

The angle of repose depends on a lot of factors, including the size and structure of the grains and the presence of water. Wet sand sticks together more readily, as the water forms links between the sand grains. This can come in handy when trying to build a sand castle, and allows a slope to form which is steeper than the angle of repose would be for a dry granular material. Thus if we know what the angle of repose of a slope should be at a site, we can tell if a slope is steeper than expected, and thus must consist or wet sand or a different material which is more stable. If it is shallower than expected then we know that this slope is not yet at the angle of repose, and more material can accumulate there before it risks becoming unstable. 

But how do we determine what the expected angle of repose should be? On earth this si quite well constrained for different materials, although it can vary substantially from site to site. For a long time it has been thought that the angle of repose was independent of gravity, and so the same materials should form similarly steep slopes on any planet. However a recent study has cast doubt on this. 

Researchers set up a large number of rotating drums of sand and gravel in an experimental aircraft and filmed them using high speed cameras as they went through several parabolic flights in order to simulate different levels of gravity. The results indicated that there were substantial changes to the angle of repose due to changes in gravity. The paper itself can be found here, and this blog has a good overview of it for anyone who can’t access the paper itself but wants more detail than is included in the abstract. 

If these results are confirmed it could have some very interesting implications for interpreting the geomorphology of other planets. Angle of repose isn’t just significant when looking at sand dunes, but on any loose slope, such as those on alluvial fans and mounds of debris. Figuring out how, and if it changes with gravity could potentially give us a lot more information about these landscapes.
 
Image Credit: NASA/JPL/University of Arizona, via Google Mars

Monday 17 April 2017

Guess the Planet 26: Crescents

Here is this week's guess the planet. 
What are these crescent shaped features, and where can they be found?

Friday 14 April 2017

Combining Datasets


This week’s guess the planet image comes from Mercury and was captured by the Messenger spacecraft using two separate instruments. These are the Mercury Dual Imaging System (MDIS) which mapped the surface, and the Mercury Laser Altimeter (MLA) which recorded the topography. I’ve talked before about some of the ways of producing topographic data from orbital spacecraft. In this case a somewhat different method has been used. The instrument used a laser to record the distance between its orbital position and the ground. Since the movement of the spacecraft is known very precisely it is possible to time how long it takes a laser to reach the surface and derive distance from this (since the speed of light is known). 

Here this elevation data has been combined with the visual data from the spacecrafts cameras. The result is a more useful and indeed more impressive image than either instrument could generate on its own. The elevation data has been used to create a perspective view across this part of mercury, so that details of the positive and negative relief can be clearly seen. The false colour component of the image shows the elevation, with reds indicating high features and blue  showing low elevation areas. This is a fairly standard colour scheme for showing topography, and thus allows us to interpret this landscape at a glance. More information about this area of mercury can be found at this link, to the NASA description of this image.

What we see is quite interesting. The area is clearly a cratered plain, like much of Mercury. However there is a clear divide between high elevation areas to the left of the image and lower elevation areas to the right. The divide between these, which cuts across the central crater is the Carnegie Rupes, a tectonic escarpment. “Rupes” means cliff or escarpment in Latin. This feature is the result of the gradual shrinking of mercury. It is a small planet, only slightly larger than Earth’s moon. As a result the core has cooled more rapidly than that of Earth, and this has resulted in contraction of the planet. As the planet shrinks a large number of faults and escarpments form as sections of the crust get crinkled up. 

By combining data from a variety of sources we can get a good look at the structure of the cliff in this area. This allows us to determine how and, in some cases, when it formed. For example in this location the cliffs seem to cut through the basin of the Duccio crater. This tells us that the crater must already have been present when the cliffs formed, and thus that one feature is younger than the other. Planetary scientist rarely work from isolated images, but compare and contrast between different datasets, and use overlays like this to highlight features of the landscape. Any false colour data can be combined with a visual map in order to make it clearer when variations match other features. For example instruments which measure chemical and mineral signatures on the surface can be combined with other data to indicate where specific patches of materials occur, and whether they are frequently associated with specific elements of the landscape. 

All spacecraft carry a range of different sensors, and try to collect as much diverse data on each orbit as they can. This is then transmitted back to Earth and processed and combined by the scientists who study that planet. The end result are higher level products such as this, which can be used to study the planet, or demonstrate specific features of its landscape. 

Image Credit:
ASA/Johns Hopkins University Applied Physics Laboratory/Carnegie Institution of Washington

Tuesday 11 April 2017

Guess the Planet 25: Colour

Here is this week's (slightly delayed) guess the planet. 
What is this image and which planet does it show?

Friday 7 April 2017

Volcanic Activity on Io


This week’s guess the planet image comes from the outer solar system. It shows a volcanic explosion on Io, one of Jupiter’s moons. This image was captured by the voyager 1 spacecraft in 1979, credit for this image goes to NASA. This observation was very significant, because it shows activity taking place on another solar system body, something which had not been seen before. The volcanism seen here isn’t a relic of bygone processes, it was happening as the spacecraft flew by, and volcanism on Io continues to this day.


Geological activity comes in many forms, volcanism being one of the most extreme and spectacular. We are familiar with a huge variety of geological processes from studying the Earth. On our home planet we can watch these processes in action, and see how they shape the environment. One of the key principles of geology is that, on the whole, the landscape was shaped by the same suite of processes that continue into the present day. Some processes might have been more extreme in the past, such as the action of ice during glaciations, but glacial erosion is still at work across the planet. Thus by seeing how geological processes work in the present we can form theories about how they might have occurred in the past, and how they will continue to do so in the future. 

We can interpret the landscape based on the processes most likely to have formed it, and this tells us a lot about the environment of the past. By extension this understanding of geology in action allows us to speculate about the environments of other worlds. If we can see the characteristic signs of processes such as volcanoes or glaciers, so we know that volcanism and glaciations have taken place at some point. 

Often we can see the signs of past changes to the environment; Solidified lava flows, volcanic cones and other signs of volcanism have been observed on various solar system bodies, but many of them seem to be quite old. We don’t know for certain whether these processes continue to occur, only that they once did. Environmental conditions can change massively, both over time and from one region of the solar system to another. This can cause the end results of some familiar processes to not look quite as similar as we would like. When we see activity we know that the processes still occur, and this tells us a lot about the environment. 

Our observations of the Earth are extremely comprehensive, since we have a vast number of instruments and geologists on this planet. However the other worlds of the solar system are far less easy to study. Some, such as Io have only been visited a few times, and so our observations are somewhat fleeting. This means that signs of activity aren’t always easy to spot. We have to infer a lot from relatively little evidence. Sometimes features, such as cones, could have formed through multiple processes. If we don’t know precisely when or how they formed it would be possible to draw the wrong conclusions about the environment and the processes which shaped them. This makes images like this all the more amazing. On Io we can see that volcanism is current, and so this verifies our interpretation of the landscapes of this moon.

So why does Io still have active volcanoes when many other planets and moons seem not to? Io is very small, and so it is unlikely that it would still have internal heat under normal circumstances. However its proximity to Jupiter causes substantial tidal forces on the moon. The tidal pull of Jupiter’s gravity varies as Io moves closer and further from the larger planet. This causes heating of the interior through friction, keeping large parts of the moon molten and resulting in volcanic eruptions at the surface. A moon of a similar size, which didn’t orbit as large a planet, would not be expected to be as geologically active. 

Planetary scientists look for signs of activity all across the solar system, as they have the power to verify our theories about how planets and moons formed, and how geological processes continue to shape them in the present day. 


Image Credit: NASA Planetary Photojournal